Sunday, February 24, 2013

Field Survey

Introduction
For assignment 4, the class was split into groups of two to conduct a distance azimuth survey. Basically, this type of surveying involves using a handheld laser rangefinder that is equipped with an internal compass which can calculate the azimuth of the object of interest as well as finding the distance to said object. This type of surveying is considered pretty basic as there is more high tech equipment out there which provides better accuracy. However, one of the concepts we were trying to learn was that when the large, expensive equipment fails, what can be implemented as a reliable backup? So in our case, we were exposed to the so called backup option in the laser rangefinder. The exact name of the rangefinder is the TruPulse Laser Rangefinder (Fig. 1) of which more information can be found here: http://www.lasertech.com/TruPulse-Laser-Rangefinder.aspx. This piece of equipment is not exactly cheap either, and that is because it does offer many different capabilities as well as producing accurate results. Some of the different capabilites are: Distance, Inclination, Height, Azimuth, and Missing Line. The accuracy of this particular model is +/- 1ft. on a high quality object.
Fig. 1
*The distance units this device measures in is meters.
Before we got started, we were introduced to the term DECLINATION. Declination refers to the difference between true north and magnetic north. Declination increases as one moves east or west away from the line where magnetic north and true north converge. When one moves west of this line, there will be negative declination and moving east will create a positive declination. One would then add if in a negative declination location in order to reach zero and subract in a positive declination location. Here is a map illustrating this below in Fig. 2.
Fig. 2
 
Maps are made based on magnetic north so that a compass can be used on them. Most maps put the declination formula on the map somewhere so that the user knows exactly what to calculate to compensate for this. Declination varies by year as well. One can easily find out what the declination is at any point on earth just by visiting a website that offers the formula where you just type in your zip code. Luckily, in Eau Claire, WI, we do not have to worry about calculating for declination as our declination for 2013 is: 0° 58' W changing by 0° 6' W/year, which is hardly anything! That being said, lets move on to the methodology for this project.
 
Methodology
For this exercise, we were instructed to use this device on a 1/4 hectare plot somewhere near campus and collect at least 50 points. We chose to collect point data on trees at Owen Park near the lower campus of UWEC. Here is a locational flowchart of the study area below in Fig. 3.


Fig. 3


The first thing we did upon getting to our survey location was to find a point of origin. We used a street sign that was along the road, which forms an island, in the park as our first origin and collected 27 points within the island. From there we moved to the north side of the island and then collected the remaining 23 points based off of a new point of origin. As Fig. 3 shows, there is an abundance of trees which allowed us to collect our 50 point rather quickly within half an hour. Once again, we only collected the distance from origin to each tree as well the azimuth. After we had all the data written down in a notebook, we took the data to the computer lab where all of the data was typed into an Excel spreadsheet so that in could be imported into a geodatabase in ArcMap. Here is a look at the data table in Fig. 4.


Fig. 4
The values on the left are from the first point of origin as indicated by the respective coordinate under X1,Y1. The values on the right are from the second point of origin indicated by the coordinate under X2,Y2. It should be noted here that we forgot to bring a GPS with us on our survey day to get a coordinate for our points of origin. What we did then was to zoom in to an aerial image of the location in ArcMap and best estimate where we were standing and then write down the corresponding coordinate data, which was in meters.  The point data is all the same because we are not exactly tree experts and besides, it's hard to tell the tree species when it's winter and all of the leaves are off the trees. It would have been better to have more detailed PointData to indicate different species of trees. This table was then exported into a file geodatabase, as mentioned above, so that further processes could be run on the data. After the table was in the geodatabase, we ran a tool called Bearing Distance to Line. Fig. 5 shows how to find the tool in ArcToolbox.


Fig. 5


This tool uses the X,Y coordinate info and then the related data from the Distance and Azimuth fields to draw a line which represents where the corresponding tree that was being measured is located. In Fig. 6, the results from this method can be seen for both origins. The line feature was reprojected into the WGS 1984 UTM 15N projection.


Fig. 6

Next, the line feature had to be converted to a point feature so that points could be plotted on the end of each line to indicate where each tree was located. The appropriate tool for this process is called the Feature Vertices to Point tool. Fig. 7 shows where this tool is located in ArcToolbox and Fig. 8 shows the result.


Fig. 7

Fig. 8


Discussion
This exercise was a really fun exercise to conduct because we got to use some newer technology instead of having to use a compass and tape measurer! The end results looked pretty accurate overall. There are a few exceptions however as noted with the dots that are tossed outside of the tree island onto the roads and also a stray purple line heading towards the NE section of the image. This could come from writing down the wrong distance and/or azimuth for these points. Since the equipment we used is suppose to be very accurate, I think this is what happened. Another factor is that we tried to find our exact location via an aerial image instead of taking an exact coordinate location with a GPS. This then moves the point of origin, which also means the points will be moved as well. This is a beginner mistake that can be learned from for the next time a situation like this might arise. A more accurate survey could have been conducted with better equipment but that was not an option with this exercise. For mapping out trees and such, a laser rangefinder can be very useful. However, better equipment would be necessary to conduct a survey on a more professional project. Transit lasers and total stations are industry standard nowadays as these pieces of equipment are far more complex in nature and ensure a higher level of accuracy and reliability. It was definitely a good learning experience and is just another tool that can be used if that is all that is available or if your primary equipment fails in the field. The hardest part of this project was to get all of the data uploaded and showing up in the correct spot. Once everything was in a geodatabase and shared a common projection, there were no more issues. Had we had more detailed PointData, we could have selected out some of the lines based on tree species and assigned them a different color which would have looked really cool on the final map.


Sunday, February 17, 2013

Balloon Mapping

Introduction
This week the class was introduced to a project that we will be working on for the next few weeks. We want to obtain high resolution aerial imagery through the use of balloon mapping. The plan is to construct an apparatus attached to a balloon which will take continuous photographs that can be mosaicked together to create a scene at a high resolution. In fact, we will be constructing two different devices: one for lower altitude mapping and also one called a high altitude balloon launch (HABL). The goal is to get the HABL to ascend all the way into space to get some really neat photos. It is paramount that we get a head start on this project as soon as possible to assess all of the variables that will go into both devices as well as designing the equipment and running some tests with the equipment so that we don't look foolish out on campus when the day comes to launch them. No one in the class has had any prior experience in an experiment like this so there will be some trial and error along the way. We had a chance to look over a few websites that focus on this particular experiment which gave us some important ideas and concepts to consider and somewhat of a compass to get us in the right direction. It also became apparant that the "how-to" directions available were a bit elementary and lacked some vital information. The goal of the subsequent posts on this blog are to be as descriptive as possible for the procedures involved with this project as to create a more comprehensive and detailed instructional. For the HABL device, a basic kit was obtained from an online retailer which includes the helium balloon, parachute, and a few rigging devices.

This is the website from which the balloon kit was purchased: http://publiclaboratory.org/wiki/balloon-mapping-kit

This website gave as understanding of the basic design of a balloon rig and also the parachute descent rates which will be important information for us: http://the-rocketman.com/recovery.html

Methodology
With a class of around 20 students, it was feasible to split up into different groups to tackle different tasks in a timely fashion. The list of tasks included: (1) weighing the equipment (2) device designs (3) parachute testing (4) camera/data preparation (5) testing the tracking device. Everyone was able to find a group in which to participate in and share their ideas which became an important element as our brainstorming was able to attack an objective from many different angles to achieve a better end result. Everyone was able to walk around to each group and get a sense of what they were doing and trying to accomplish so that everyone has an overall idea of what is going into this project as well as how everything will work.


Fig. 2 - More weighing of objects.
Fig. 1 - Gathering weight data.


Weights
Gathering weight data from all of the potential equipment is a vital task for this project because the size of the balloon dictates how heavy the auxillary equipment can be. For our purposes, our balloon can only handle 2 lbs. of extra equipment. Therefore, we have to assess which equipment is absolutely necessary and then engineer a rig that can support that weight while protecting the camera and ensuring quality imagery. Needless to say, it did not take long to have 2 lbs. of equipment (including camera) gathered. It is important to note that each rig will require different equipment because of the fact that they will be sent to different altitudes. A more detailed list of objects and weights can be found at the end of this post.

Low Altitude Rig
Two different groups undertook the task of designing the actual balloon rigs. For the low altitude rig, the rig includes a camera encased in a 2 liter pop bottle, fitted to secure the camera from moving around too much during flight. This rig will be a bit more simplistic than the HABL rig will be. Two different models were created for the low altitude rig. The prototypes can be seen below.
 
 
Fig. 3 - First model with stability wings.
Fig. 4 - The "Hindenberg" pop bottle apparatus.

Fig. 5 - View from below illustrating how camera will hang in the first prototype.
  
In Figure 3, an empty bleach bottle was implemented and plastic wings were attached to ensure stability to deter atmospheric winds from interrupting the photography. The camera will be secured within the bottle by attached strings running through the top of the bottle. Figure 4 depicts a 2 liter pop bottle in which a sqaure section was cut out directly beneath the camera and the use of plastic zip ties to secure the camera to the bottle. Two pieces of string were fastened to each end of the bottle and knotted together at the top by which the device will hang and balance. We have yet to test either model out so it will be interesting to see which device performs better.

HABL 
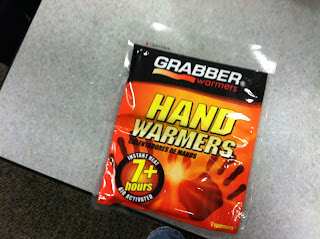
The HABL rig requires a bit attention because it will be expected to reach very high altitudes in which the temperature drops below freezing and therefore issues arise with how the equipment will react to temperature changes. We decided that an insulated foam minnow bucket would work quite well as the carrier device because it has insulation properties as well as it will provide more cushion when it descends back to the ground. Bear in mind that we are working with a limited budget and proving that this balloon launch can be achieved with easily accessible and cheap equipment. A basic diagram of the rig can be seen in Figure 6. The camera will be fastened to the bottom of the bucket via plastic zip ties and then hand warmers will be arranged around and on top of the camera to maintain a warmer temperature inside of the bucket. This is a very crucial element of the project, to ensure the camera does not get exposed to the fridgid temperatures in the upper atmosphere.
Fig. 6 - Basic model of how the rig will be assembled.

Fig. 7- Cutting a small square hole in the bottom of the minnow bucket which will serve as the view frame for the camera.


Fig. 8 - View hole for the camera while preserving any unnecesary exposure of equipment.
 
 
Fig. 9 - Cutting a circular piece of foam insulation which will sit in the bucket on top of where the camera lies and which will secure the hand warmers sitting around and atop of the camera.


 Parachute Testing
 Since the HABL will be descending from very high altitudes, as the balloon will eventually expand too far and pop, it is necessary to rig the device with a parachute. This was a control model that would could test right away. We obtained the parachute that was appropriated with the balloon kit and then put 2 lbs. of weight inside of the minnow bucket carrier device. Once the bucket was fastened properly, we took the rig up four stories high to drop it out the window and see how well the parachute would work. This was the funnest part of the project so far.
Fig. 10 - This is the HABL rig (minus balloon) getting ready for the test drop.

 After dropping the rig out the window 3 times, we noticed that the parachute was not slowing down the rig as much as we had hoped. That being said, the minnow bucket did a great job of protecting the contents inside and after hitting concrete, no cracks or holes were found on the bucket. It will need to be determined if we need to exclude more weight from this rig which will be very challenging.


Camera
For this project, it would be ideal to use a GoPro camera since they are designed for such uses. However, this was not feasible so a basic digital camera will be used instead. It was important to test the camera out to ensure the continuous photo mode worked well and also how fast the memory card would fill up. We also wanted to determine which would take up more memory: pictures or video. Since video records sound with it, photo mode is the way to go. The largest memory card we have is a 32gb SD card. This should suffice for the amount of imagery we need. We also needed a way to keep the camera button down so that the camera will take continuous shots while in the air. For this, a rubber band was wrapped tightly around the camera with a penny underneath which did a fine job of holding the button down. This is they key to the project so it is absolutely necessary that we know what is going to work and also figuring out a way to suspend the camera to take high quality photos.

Fig. 11 - Rubber band used to hold down button.
Fig. 12 - View of how camera will be suspended.


Fig. 13 - Taped up and ready for action.


Tracking Device
Once the HABL descends from the upper atmoshpere, the device will undoubtingly get blown a distance away from the launch site. For this reason, a tracking device is a must to be able to locate where the device ends up(most likely in a tree or a lake). A small GPS tracking device will be attached to the rig and we will be able to link that to an iPad to track its path. We tested this device out briefly and it works great.

Discussion
Many important elements are present in this project. For one, preparation is key to success. Without any advanced preparation, we would be doomed for failure and look like idiots. Obviously, we do not want this, we have too much pride. This project is good practice to be able to brainstorm through different ideas with a bunch of people involved. Teamwork is also crucial. Forming good relationships with fellow team members helps make the project fun and also successful. The ability to delegate work to different individuals helps keep the process running smoothly and quickly and diffuses responsibility to everyone involved. In subsequent weeks we will be building off what we have learned each week and then apply new concepts and ideas that come to us throughout the week. A project like this can seem very simple to undertake, however, it is becoming evident that it's going to take a lot of planning a preparation for us to be successful. The end product will be really cool to put together and it's going to be a very unique experience. In the coming weeks, we will need to agree on final model for both rigs and also develop a practical way to fill the balloon with helium. We have not yet researched any methods dealing with that step of the process. Also, we will need to look at how we will mosaic the images together and deal with any sort of distortion or varying camera angles. The list of materials and their corresponding weights are listed below with accompanying photos.


Fig. 14 - Weights for all the possible equipment available.


Fig. 15 - Carabiner which will connect apparatus to the rope.

Fig. 16 - Hand Warmers to insulate and keep camera warm.

Fig. 17 - Main source of fastening devices.

Fig. 18 - Long rubberband to perhaps wrap around the minnow bucket.

Fig. 19 - More rubberbands.

Fig. 20 - Large rubberbands which are stronger.
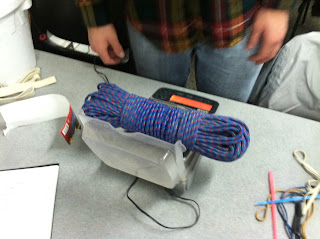
Fig. 21 - 3/16" rope which will be used to harness the minnow bucket to parachute.
 
Fig. 22 - The parachute in it's condensed form.

Sunday, February 10, 2013

Digital Terrain Model Part 2


Introduction
After formulating a coordinate system last week to create a DTM of a miniature landscape we created in a planter box, we were given the opportunity to do the field survey over again to improve our results. Our methodology in the first week involved using lengths of twine pinned to the side boards of the planter box for both the X and Y axis. The grid cells were 10cm x 10cm which resulted in a very coarse survey, missing important elevation changes that resulted in a very imprecise model of the actual landscape. This lead to a very generic looking landscape that did not illustrate properly all of the elevation changes and generalized the landscape features. This became evident when the data points were uploaded into ArcMap and various interpolation methods were applied. More detail about the interpolation methods will be talked about later on in the methodology section. For our second survey, which occurred exactly a week later, we had a slightly warmer day to work in and the landscape was relatively the same with the exception of an extra layer of light snow which had fallen a few days earlier. In order to ensure the landscape was more completely represented, it was decided that a 5cm x 5cm grid system be implemented. After all, what good is a DTM if it does not represent the landscape in detail?
Methodology
Once again, we had no advanced technology but rather we used our lengths of twine that had already been cut to size and pinned them to the side boards on the planter box every 5cm along the X axis, parallel to the Y axis, resulting in lines of longitude. Instead of running lines horizontally, we used a yardstick as a portable X axis to move every 5cm and then take the data readings at the vertices. This method is better depicted in Figure 1. This really sped up the process of collecting our data points. We also sent one member of the crew to the computer lab set up with an Excel spreadsheet to input the coordinate values in real time as we were connected via Bluetooth. This saved a lot of time by not having to manually write down every data point with pen and pencil as we had done the first time out and then go enter them into the computer. The whole process took around 2 hours from set up to take down. In the end, we had collected nearly 1000 data points! Communication was much improved and the process was a lot more streamlined this time around as our team had learned what needed to be improved from the week before.The points were then successfully uploaded into ArcMap and then interpolation was run once again to see how improved the DTM was. The interpolation methods used for this exercise are detailed below with a brief description and the corresponding image. We were required to run 5 interpolation processes on the original data and then choose the best one for the second data set.


Fig. 1 - New and quicker way for gathering data points at the vertices with a moveable 'X' axis.


Results

Below are the results of all the interpolation methods. Once again, sea level was the top of the planter box and we decided not to drop the sea level after we had collected all of our data but maybe should have to make it more realistic. All of the elevation units are in centimeters. The 3D maps were created in ArcScene and a base height multiplier of 0.75 was used to exaggerate the terrain a bit more to make it easier to interpret.


Fig. 2 - Data points after being uploaded into ArcMap


Fig. 3 - The natural neighbor method is more of a locally based interpolation method, that is, a central value is determined and then only a small subset of values closest to the reference value are used and weighted to determine the gap values. Natural neighbor does not introduce faux peaks, valleys, or ridges that are not present in the data set. The surface passes through the input samples resulting in a smooth surface everywhere except at the locations of input data samples. This method resulted in a pretty accurate model of the actual surface and is a lot smoother than the IDW output.


Fig. 4 Spline interpolation uses a mathematical formula which looks to minimize overall curvature of the surface, resulting in a smooth looking output. The surface passes exactly through the data points while picking up on rapid changes in gradient or slope. I think that this method produced the most accurate output of all the interpolation methods used. The surface is detailed and smooth looking, picking up all of the elevation changes quite well. The river bed running along the western side of the box is quite detailed as well as the horseshoe shaped ridge line in the northeast. 


Fig. 5 - A TIN surface is a surface of triangular irregular networks and is a way to show surface morphology in a digital format. Triangles are constructed by triangulating a set of vertices. This method captures the position of linear features such as ridgelines or streams. Overall, this method is suited to showing better precision in areas where the surface changes while there is lower resolution where little changes occur. *ArcScene kept crashing when the TIN was inputted, therefore there is no 3D oblique view of the TIN.


Fig. 6 - Inverse distance weighted (IDW) interpolation determines cell values using a weighted distance combination of a set of sample points derived from the data. The further away the point is from the sampled location, the less influence that value has. This method is designed to be less smooth and give the surface more detail. This method gave a pretty good rendition of the actual plot. However, notice how unsmooth the surface. The resulting output looks very blotchy and just doesn't mesh together very well.


Fig. 7 - The kriging interpolation method generates a surface estimated from a scattered set of points. Kriging takes into account spatial autocorrelation and therefore is based on statistical analysis of all the points and how they interact with each other. This method did not do a very detailed job of creating a realistic surface but over generalized the plotted area. It is clear that this method does not depict very well the changes in elevation or replicate the geographic features.


Conclusion

The team as a whole agreed that given a second swing at this project, we learned a great deal about teamwork, data collection, and data manipulation. During the first week we were sort of thrown in the fire right away and were pretty narrow minded. However, after being able to visualize our first data set, we knew right away that we could greatly improve our results. We also took it a bit more seriously the second time around and definitely wanted to build on what we had learned the first week. Having to use interpolation in the future is very likely so it was very beneficial gaining an understanding of how interpolation works and the different methods as well as their corresponding strengths and weaknesses. Not understanding this could lead to misinterpretation of data and unusable output maps. 


Saturday, February 2, 2013

The first assignment of the 2013 fall semester was to create our own coordinate system, using our own creativity. The idea was to create a microcosm of a large area and be able to develop a coordinate system and collect point data in order to upload the points into a GIS and map the landscape with x,y,z (length, width, and height) values. The coordinate system was applied to a landscape which the group created inside of a planter box. The landscape was made of snow and included: mountains, rivers, valleys and ridges.

The dimensions of the planter box was 100 cm x 230 cm. My group developed a Cartesian  coordinate system and decided to split the planter box up into 10 cm x 10 cm grid cells. The origin was set in the southwest corner of the planter box to ensure positive values. The top of the planter box was used temporarily as sea level. However, with a lack of sufficient snow, we were unable to build features much taller than the top of the box. Our sea level will be lowered by a yet to be determined amount of centimeters to ensure that our geographic features are best represented. We used cut length pieces of twine to make our grid which was pinned to the planter box and then a yardstick was used to collect elevation at each of the grid vertices. The whole process took around 2 hours from set up to a complete data set of x,y,z values.

This exercise was a really neat project because it allowed us to use our own creativity and prior knowledge of coordinate systems and apply it to a geographic model. It also reemphasizes the fact that you do not need GPS points in order to create a map in a GIS, but rather the data can be collected the old fashioned way and then be uploaded into the software as long as there is a workable coordinate system. After collecting the data points, it was then realized that a 10 x 10 cm grid was probably a bit too course and that a 5 x 5 cm grid structure would have better captured elevation changes and would have generated a more comprehensive landscape. The pictures illustrate some of the progress throughout this field outing.

Creating the Landscape

Beginning Stages of the Grid

Getting Elevation Data

Completed Grid